How to build a restaurant budget that protects your 3% margins

Are your restaurant's profits vanishing into volatile food costs and bloated schedules? With average net margins hovering at just 3% to 5%, surviving requires turning your budget from an annual chore into a daily operational shield.
The structure of a highly efficient restaurant budget
A successful restaurant budget lives in layers, categorized by fixed and variable overhead. To measure financial health accurately, you must target established industry baselines.
- Prime cost: This is your total cost of goods sold (COGS) plus variable labor. Healthy restaurant groups keep prime cost under 55% to 60% of sales.
- Cost of goods sold: Average food costs sit at 30.5% of total food sales, though general benchmarks range between 28% and 35% depending on your concept.
- Store labor: Store labor typically hovers around 29% of sales, though quick-service is often lower (25% to 30%) and fine dining pushes higher.
- Occupancy: Rent, CAM, and property taxes should ideally consume between 6% and 10% of your sales.
- EBITDAR margin: Earnings before interest, taxes, depreciation, amortization, and rent should hover around 9.2% of total sales to meet standard industry efficiency benchmarks.
Understanding these baselines is only the first step. To maintain long-term viability, operators need comprehensive restaurant financial management systems to prevent cash flow leaks before they start.
Mastering restaurant sales forecasting
Forecasting is the practice of predicting future sales using data, trends, and external variables to optimize staffing and purchasing. Most operators use three main forecasting methodologies:
- Time-series forecasting: Based entirely on historical sales patterns, comparing rolling 4-week averages or month-over-same-month metrics.
- Causal forecasting: Linking sales projections to external drivers such as upcoming weather patterns, local events, or holidays.
- Qualitative forecasting: Relying on expert judgment and local knowledge, particularly useful when hard data is scarce.
For existing operations, you can calculate your projections using two core formulas:
- Baseline capacity formula: Table Count × Average Number of Seats per Table × Average Guest Spend = Daily Capacity. This helps you calculate what your room can generate at standard utilization.
- Historical-data-based formula: Expected number of diners × Average food and drink sales = Simple sales forecast.
If you are planning a new location without historical data, build your assumptions from seating capacity, target menu prices, hours of operation, and expected utilization by daypart. Supplement these guesses with local competitor analysis and neighborhood demographics. Regularly comparing actual sales to these targets allows you to adjust your restaurant financial projections and improve scheduling accuracy over time.
Controlling costs in real time
A budget on a shelf does nothing. Real-time control means tracking your daily and weekly variances, particularly for food and labor.
Start by measuring theoretical versus actual food cost. If your standardized recipes indicate a 30% cost but your actual inventory count reveals 34%, that 4-point gap represents waste, portion bloat, or theft. Transitioning from periodic audits to restaurant inventory management best practices helps you spot these leaks. By integrating POS with inventory management systems, every sale automatically deducts exact recipe ingredients in seconds, lowering food costs by 2% to 5% on average.

Labor requires the same precise oversight. Instead of scheduling shifts out of habit, use POS historical data to match scheduled hours to real demand. Utilizing proactive restaurant labor cost control strategies can cut labor costs by up to 15%. When managers write schedules two weeks out, they avoid last-minute overtime and no-shows. Implement structured restaurant shift scheduling tips to keep hours aligned with expected daily cover patterns and keep staff happier.
When you audit your kitchen workflows, optimize tableside steps, and align schedules to real demand, you systematically discover how to improve restaurant operations and reclaim missing margins.
The hidden math of technology: Total Cost of Ownership
Many operators purchase software or hardware based solely on the upfront sticker price. To prevent cash flow surprises, you must calculate the Total Cost of Ownership (TCO).
TCO is a comprehensive assessment that quantifies the full lifecycle cost of a tool. It covers direct costs like hardware acquisition and software licenses, but also accounts for:
- Direct upfront fees: Hardware, printers, network setup, and professional installation.
- Support and maintenance: Upgrades, monthly SaaS fees, payment processing markups, and annual maintenance contracts.
- Training and onboarding: The cost of training crew members (typically 4 to 16 hours per location) and temporary productivity drops during switchover.
- Opportunity costs: The hidden cost of system downtime, manual reconciliation, and administrative labor spent troubleshooting errors.
If you run a cost-benefit analysis of upgrading restaurant POS systems, you will find first-year TCO for a small single-terminal setup ranges from $1,200 to $4,500, while medium operations hit $3,500 to $12,000. However, the right technology yields major returns. The long-term benefits of POS systems in restaurants include cutting table turn times by 10 to 15 minutes, which allows dining rooms to capture 8% to 12% more covers during peak rushes and easily offsets the initial investment.
Modernizing operations without the price tag
If upfront tech costs are keeping you on outdated software, you can skip the expensive transition period.
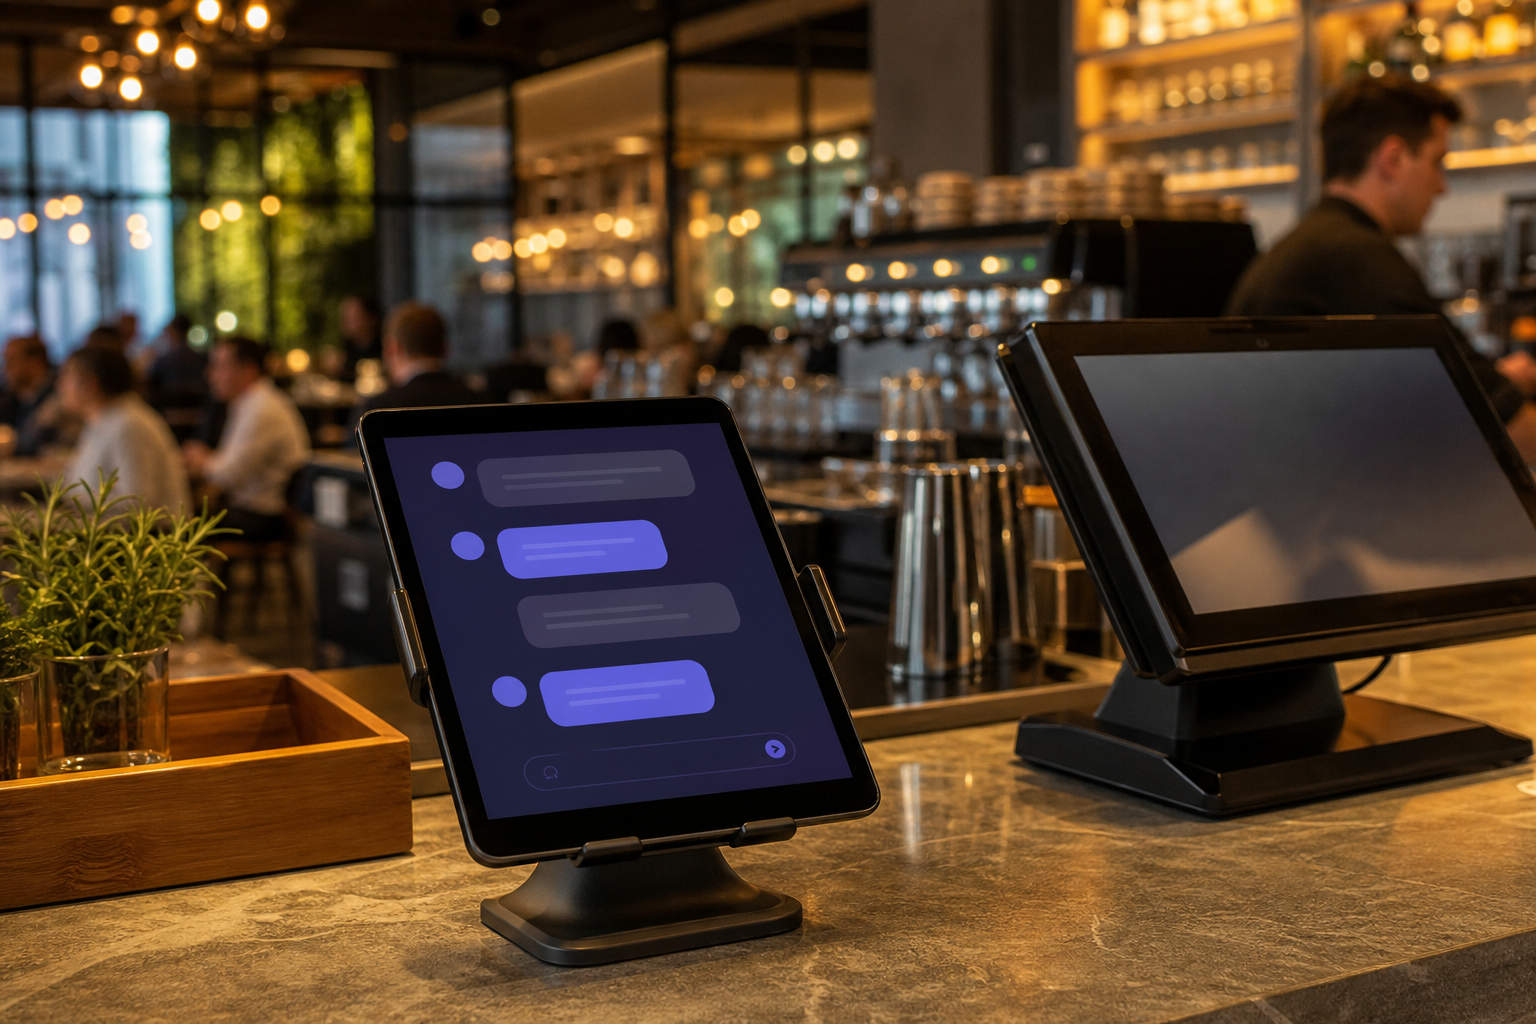
Meet AgenticPOS (https://agenticpos.ai). It is an MCP server that lets AI agents control your restaurant’s POS directly through chat. Instead of clicking through dense back-office dashboards, you can manage menus, adjust pricing, modify shifts, and view real-time analytics by talking to Claude, ChatGPT, or Slack bots. It features 140+ agent-callable tools and supports multi-location control. Best of all, you can start using AgenticPOS for free on the POS system you already own.
When you are ready to retire your legacy hardware, you can scale directly into Spindl, the world's first agentic restaurant OS. Spindl unifies point-of-sale, built-in delivery integrations, online ordering, loyalty programs, and real-time inventory into a single device. Instead of paying for a "tablet farm" of redundant subscriptions, you get a clean, delivery-native flow that aligns your entire restaurant supply chain management system. Review spindl's pricing plans to see how keeping POS software free for Pro users eliminates monthly billing surprises.
Actionable weekly budgeting discipline
To make budgeting a highly effective tool, establish a weekly rhythm and monitor these key metrics:
- Track inventory turnover: Target 4 to 8 turns per month to prevent food spoilage and avoid tying up cash in dead stock.
- Calculate RevPASH weekly: Monitor Revenue per Available Seat Hour (sales divided by total seats times hours open) to spot quiet shifts.
- Analyze your menu mix: Group menu items into Stars (high margin, high popularity), Plow Horses (low margin, high popularity), Puzzles (high margin, low popularity), and Dogs (low margin, low popularity).
- Review prime cost percentages: Ensure total food and labor expenses stay firmly below the 60% mark.
Restaurant budgeting is not about restriction – it is about visibility. By using real-time data to control margins, you protect your business from sudden inflation and high labor costs. Start leveraging automation to reclaim your time and profits today.