Kuidas hoida seitsme lihtsa küsitlusküsimusega ära 375 000-dollarine kliendikadu kiirtoidukohas
Enamik kiirtoidukoha kliente ei kurda – nad lihtsalt ei tule enam kunagi tagasi. See hääletu kliendikadu ehk vaikne kliendivoolavus läheb toitlustusettevõtetele maksma keskmiselt 375 380 dollarit saamata jäänud tulu aastas iga üksiku toidukoha kohta. Järgnevalt vaatame, kuidas luua lühike ja tabav kliendiküsitlus, mida kliendid ka tegelikult täita viitsivad.
Statistika kohaselt ei naase tervelt 75% esmakülastajatest, kes peavad liiga kaua ootama, enam kunagi. Samas on püsikliendi eluaegne väärtus keskmiselt 1560 dollarit, võrreldes vaid 555 dollariga nende puhul, kes lahkuvad juba pärast ühte halba kogemust. Sellise kliendilekke peatamiseks tuleb oletuste tegemise asemel hakata tulemusi reaalselt mõõtma. Hästi sihitud restorani kliendirahulolu küsitlus on teie parim kaitsekilp vaikse kliendikaotuse vastu.
Üldise kogemuse mõõtmine
Teie peamine prioriteet peaks olema üldise kliendirahulolu skoori (CSAT) väljaselgitamine. Küsige oma külalistelt: "Kui rahule jäite täna meie külastusega tervikuna?"
Kõige täpsemate tulemuste saamiseks tasub kasutada viiepunktilist sõnaliste vastustega skaalat. Vältige pelgalt numbreid ja siduge iga punkt konkreetse hinnanguga: "Väga rahul", "Rahul", "Ei rahul ega rahulolematu", "Rahulolematu" ning "Väga rahulolematu".
Ameerika kliendirahulolu indeksi (ACSI) andmetel oli kiirtoitlustussektori keskmine rahuloluskoor 2025. aastal 79 punkti 100-st. Kuigi neli viiest tarbijast on oma kiirtoidukogemusega üldjoontes rahul, erineb rahulolu tase teeninduskanalite lõikes märgatavalt. Letiteenindus kohapeal saavutab keskmiselt 85% rahulolu ja autoteenindus (drive-thru) püsib 83% juures, samas kui iseteeninduskioskid jäävad maha vaid 70%-ga. Selle baastaseme pidev jälgimine aitab kohalikud teenindusprobleemid tuvastada enne, kui need teie Google'i reitingu põhja viivad.
Tellimuste täpsus
Vead tellimuste täitmisel on vaiksed, kuid järjekindlad kasumiööjad. Küsige külastajatelt otse: "Kas teie tellimus oli 100% täpne, sealhulgas kõik erisoovid ja muudatused?"
Sektori keskmine tellimuste täpsuse näitaja on 85 punkti 100-st. Kui täpsus väheneb, suureneb tooraine raiskamine ja kliendi kannatlikkus katkes kiiresti. Hoidke see küsimus võimalikult lihtne ja ühemõtteline. Vältige kaheosalisi küsimusi nagu näiteks: "Kas teie tellimus oli täpne ja toit kuum?". Need teemad tuleks alati lahku lüüa.
Kui teie täpsusnäitajad jäävad ootustele alla, on see selge märk vajadusest taristu uuendamise järele. Kaasaegse Spindli operatsioonisüsteemi kasutuselevõtt tagab, et kõik kioskitest, autoteenindusest ja kullerteenustest saabuvad tellimused jooksevad ühele ja samale ekraanile. See välistab käsitsi sisestamise vead ja vananenud riistvara piirangud.
Teeninduskiirus
Ooteajad määravad kliendi lojaalsuse. Küsige külalistelt: "Kuidas hindate meie teeninduskiirust?"
Kiirus on kiirtoidus edu võti. Umbes 27% USA tarbijatest eeldab, et saab toidu kätte 2–3 minuti jooksul pärast tellimuse esitamist. Veel 42% leiab, et 5 minutit on maksimaalne vastuvõetav ooteaja piir.
Kui külastajad märgivad teie kiirust järjepidevalt "aeglaseks", on teenindusprotsessis tekkinud pudelikael. Süstemaatiline ooteaja lühendamine restoranides suurendab teie läbilaskevõimet ja hoiab ära olukorrad, kus kliendid autoteeninduse järjekorrast lihtsalt minema sõidavad. Isegi tagasihoidlik 10%-line tõus tellimuste vormistamise ja täitmise kiiruses võib tuua tuhandeid dollareid lisatulu kuus.
Toidu temperatuur ja kvaliteet
Selleks, et tuvastada seadmete rikkeid või tarneviivitusi, tasub küsida: "Kas toit serveeriti teile õigel temperatuuril?"
Kiirtoitlustuse toidukvaliteedi keskmine võrdlusnäitaja on 84 punkti 100-st. Kui kojuveo tellimuste puhul kurdetakse pidevalt "külmade friikartulite" üle, on teie toidu üleandmise või pakkimise protsessis kusagil viga.
Kullerfirmade rakenduste koondamine ühte liidesesse hoiab ära toidu liiga pika seismise väljastusletis. Otsesed integratsioonid viivad köögi töö kooskõlla kullerite tegeliku saabumisajaga, tagades kuuma toidu kohese teelepaneku.
Personali sõbralikkus ja tähelepanelikkus
Teenindajate sõbralikkus peegeldab otseselt meeskonna stressitaset ja töökoormust. Küsige oma külalistelt: "Kas meie töötajad panid teid tundma oodatu ja väärtustatuna?"
Sektori keskmine näitaja töötajate viisakuse ja abivalmiduse kohta on 84 punkti 100-st. Suure koormusega vahetused ja krooniline tööjõupuudus viivad otseteed teeninduskvaliteedi languseni. Kui töötajad peavad korraga jälgima viit erinevat tellimustahvlit, on võimatu pakkuda siiralt sõbralikku teenindust. Selle näitaja jälgimine aitab juhtkonnal märgata töötajate läbipõlemise märke enne, kui see hakkab otseselt mõjutama külaliste kogemust.
Soovitusindeks (NPS)
Mõõtke oma brändi tugevust ja soovitustõenäosust ühe lihtsa küsimusega: "Kui tõenäoliselt soovitaksite meid oma sõbrale või kolleegile skaalal 0–10?"
See üksainus küsimus on endiselt ettevõtte kasvupotentsiaali prognoosimise kuldstandard. Kõrge hinde andnud soovitajad andestavad teeninduses kergemini väiksemaid eksimusi ning nende suusõnaline soovitus on teie kõige väärtuslikum turunduskanal.
Avatud küsimus parendusettepanekute saamiseks
Kuigi numbrilised näitajad näitavad, mis toimub, aitab sisuline tagasiside mõista, miks see nii on. Küsige külalistelt: "Mis on see üks asi, mida oleksime saanud teha paremini, et teie külastus oleks olnud täiuslik?"
Hoidke küsimuse sõnastus lihtne ja konkreetne. Üks toitlustaja, kes kohandas portsjonite suurust just sellisest avatud küsimusest saadud tagasiside põhjal, kasvatas korduvkülastuste arvu tervelt 22%.
Strateegiad toimivate küsitluste läbiviimiseks
Küsitlustele vastamise aktiivsuse suurendamiseks peavad need olema fookustatud. Hoidke küsitlused lühikesed – ideaalis võiks neis olla vaid 5 kuni 7 küsimust. See aitab vältida vastajate väsimust ja hoiab vastamismäära kõrgena.
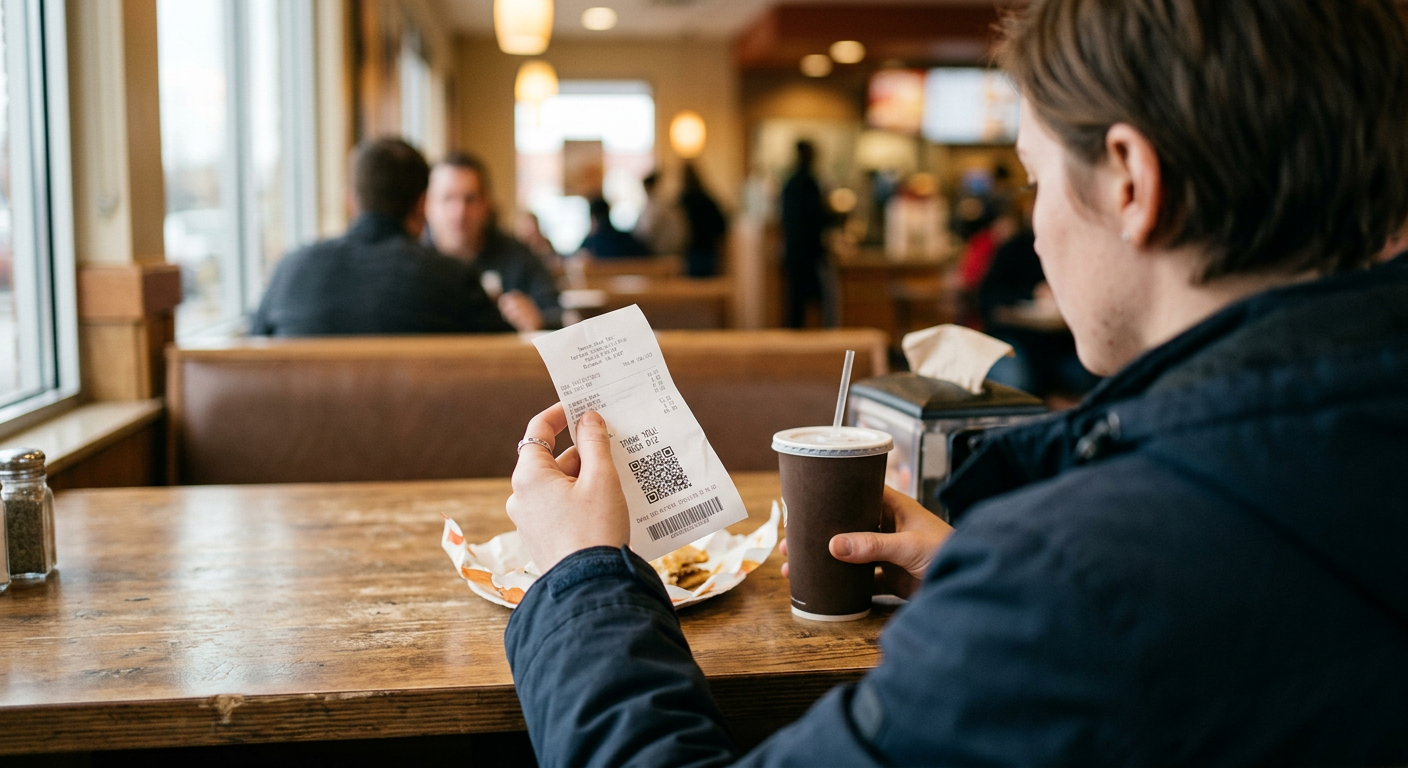
Suurt rolli mängib ka küsitluse jagamise viis. Kõige parema vastamismäära tagavad mugavad lahendused, nagu kviitungil olevad QR-kodud, lauapealsed tahvelarvutid või külastusjärgne SMS. Väikese stiimuli, näiteks sooduskupongi või tasuta lisandi pakkumine võib tõsta küsitluse täidetuse tagasihoidlikult 8%-lt lausa 31%-le.
Kui külaline jätab negatiivset tagasisidet, peavad teil olema koheselt rakendatavad kaebuste lahendamise strateegiad restoranis. Rahulolematu kliendi tagasivõitmine veel enne, kui ta majast lahkub, toimib teie maine parima kaitsena. Ühe tärni võrra kõrgem reiting avalikes arvustuskeskkondades võib kasvatada restorani käivet 5% kuni 9%. Rakendades tõhusat arvustuste haldamist restoranides, saate suunata rahulolevad soovitajad avalikele lehtedele ning rahulolematud kliendid privaatsete lahendusvormide juurde.
Küsitluste käsitsi haldamine on lisatöö, milleks teie kiirel personalil puudub aeg. Vajate ühtseid restorani tagasisidelahendusi, mis seovad klientide rahulolu otse reaalajas toimivate kassaandmetega (POS).
Et alustada ilma olemasolevat tehnoloogilist baasi täielikult välja vahetamata, saate tasuta proovida platvormi AgenticPOS. AgenticPOS ühendub teie praeguse kassasüsteemiga ja teeb põhilised toimingud – nagu kampaaniad, vahetused ja reaalajas aruandlus – otse kättesaadavaks tehisintellekti agentidele. Saate igapäevaseid ülesandeid hallata Claude'i, ChatGPT või Slacki robotite kaudu, ilma et peaksite navigeerima keerukatel töölaudadel.
Kui teie äri kasvab ja mitme asukoha haldamine muutub keerukamaks, saate sujuvalt üle minna terviklikule Spindli operatsioonisüsteemile, mis ühendab tellimuste vastuvõtmise, lojaalsusprogrammid ja automatiseeritud klienditagasiside. Lõpetage tulu kaotamine vaikse kliendikaotuse tõttu ja uurige juba täna, kuidas Spindli abil suurendada toitlustuses kliendirahulolu.