Restaurant budgeting: A practical guide to controlling costs and boosting profitability
Food costs jumped 15% overnight. Your labor budget just exploded. That shiny new POS still bleeds cash. Welcome to restaurant economics in 2025.
The U.S. restaurant industry is projected to hit $1.5 trillion in sales this year, yet average net profit margins hover around 3-5%. With prime cost (food plus labor) typically consuming 55-65% of revenue, mastering your budget isn't optional – it's survival.
Most restaurant budgets fail because operators treat them as annual exercises rather than weekly discipline. This guide shows you how to build a budget that works, control the costs that matter, and evaluate technology investments that actually move your numbers.
Understanding your restaurant's budget structure
Your restaurant budget lives in three layers, each demanding different management approaches.
Revenue projections must reflect reality, not optimism. Break down by channel – dine-in, takeout, delivery, catering – and by daypart. If you're forecasting $40,000 monthly dinner sales but your 60-seat dining room turns only 1.2 times per night at 65% capacity with a $32 average check, your math doesn't work. Build from the bottom: seats × turns × occupancy × average check. One casual dining operator discovered a 15% weekday lunch decline by analyzing hourly POS data. They launched an express lunch menu and recovered the revenue within four weeks.
Variable costs scale with sales. Food and beverage costs should run 28-32% of revenue for most concepts, though quick-service can hit 25-30% while fine dining pushes higher. Labor typically targets 30-35% for full-service restaurants and 25-30% for quick-service. Payment processing adds another 2.5-3.5%. Every percentage point matters when margins are this thin.
Fixed costs stay constant regardless of covers: rent (ideally 6-12% of revenue), insurance, licenses, utilities, base salaries, and debt service. These are your monthly burn rate – the nut you must crack before earning a dollar of profit. If your prime cost exceeds 65%, you're leaving zero room for overhead, debt service, or profit. The restaurant industry's average 3-5% net margin means a single percentage point can determine whether you're profitable or shuttered.
Building your restaurant budget from the ground up
Start with last year's P&L and POS data. No history? Use comparable restaurants and conservative industry benchmarks, then adjust as your data accumulates.
Map your revenue streams by channel and daypart. Don't lump Monday breakfast with Saturday dinner – they perform differently. Track dine-in separately from takeout and delivery, which now account for 40% of total restaurant volume. Include catering, events, and alcohol versus food mix. Digital channels are projected to drive 70% of restaurant sales by 2025, making these distinctions critical to accurate forecasting.
Account for seasonality. If you're a patio concept in Chicago, January won't match July. Build monthly targets that reflect your market reality, anticipating 20-30% swings between peak and slow periods.
Forecast your prime cost with precision. Food cost starts with costing every menu recipe, estimating your sales mix (percentage each item represents), calculating weighted average food cost, then adding 2-5% variance for waste, theft, and comps. Target 28-32% of revenue for most concepts. A steakhouse reduced their food cost by 1.7 percentage points in four weeks by tightening portioning controls alone, saving roughly $850 monthly on a $50,000 ribeye spend.
For labor cost, map coverage needs by daypart – Monday lunch requires fewer servers than Friday dinner. Calculate base hours × hourly rates, add payroll taxes (minimum 7.65% FICA), workers' comp, benefits, manager salaries, and training time. Restaurants using predictive scheduling achieve 4-6% annual labor cost reductions by matching staffing to actual demand patterns.
Layer in fixed costs systematically. List every recurring expense: occupancy (rent, CAM charges, property tax), utilities (typically $1.50-$3.00 per square foot monthly), technology subscriptions, insurance (general liability, property, workers' comp, liquor bonds), marketing (budget 3-6% of revenue in year one, 2-4% thereafter), and maintenance (set aside 1-2% of revenue). A walk-in compressor replacement costs $3,000-$8,000. Budget for it or scramble when it fails at peak season.

Controlling operating costs in real time
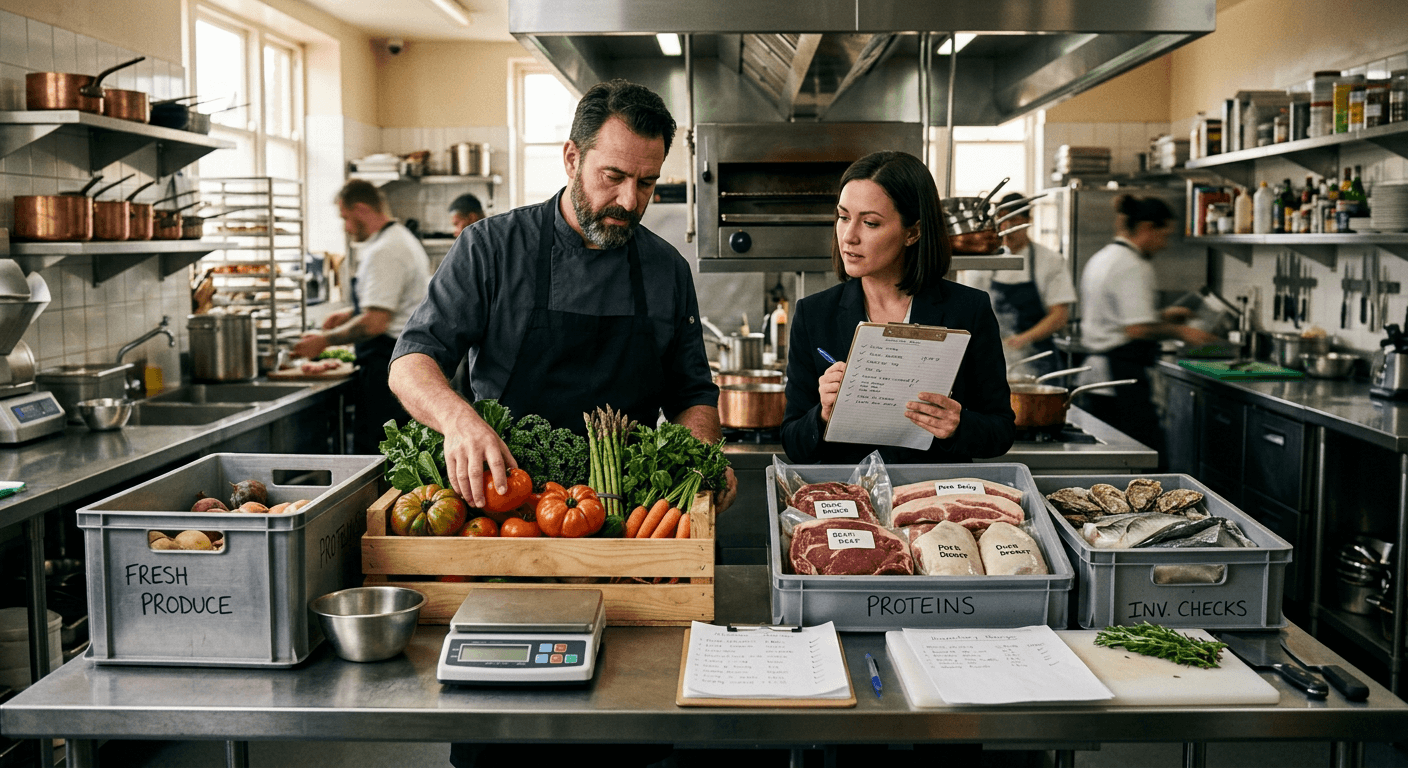
Budgets die when they sit in drawers. Control costs by tracking them weekly – or daily for high-value items like premium proteins and labor during peak periods.
Track theoretical versus actual food cost. Your recipes say you should run 30% food cost. Your P&L shows 34%. That 4-point gap – roughly $4,000 monthly on $100,000 in food sales – is your action target. Monitor inventory turns, targeting 4-8 turns per month. Slower means waste; faster might indicate stockouts. One steakhouse cut discarded ribeye from 15 to 0 pounds weekly through data-driven inventory management, saving $15,600 annually.
Use variance analysis to pinpoint problems. If ground beef shows 8 pounds over theoretical usage, you're either over-portioning, recording recipes incorrectly, or experiencing theft. Integrated inventory systems that connect to your POS auto-deduct ingredients when items sell, catching variance in real time while reducing inventory counting time by up to 75%.
Schedule labor to demand, not habit. If your POS data shows Tuesday dinner generates $1,200 from 6-9pm and you target $150 per labor hour, you need 8 labor hours – not the 12 you've been scheduling out of habit. AI-driven scheduling can deliver up to 15% labor cost reduction while maintaining service quality. For a $2 million-revenue restaurant running 30% labor, reducing labor percentage by just 2% saves $10,000 annually.
Cross-train your team to create flexibility. One Maine seafood restaurant discovered their servers could handle 25% more tables with better section optimization – no new hires required. Track productivity by role using sales per labor hour. If your expo station consistently shows $80/hour while the floor averages $140/hour, you've found your bottleneck.
Audit your tech stack quarterly. Restaurant operators often run 8+ different systems: POS, delivery tablets, inventory, scheduling, payroll, accounting, loyalty, and marketing. Each costs $50-$200 monthly, requires training, and creates data silos. One pizzeria consolidated platforms and cut administrative tasks by 15 hours weekly – that's $6,500 annually at $25/hour, enough to fund the consolidation itself. Spindl's all-in-one platform consolidates order taking, delivery management, POS, loyalty, and analytics into a single device, eliminating the "tablet farm" cluttering your expo station and the redundant subscription costs bleeding your budget.
Forecasting expenses and avoiding cash flow disasters
Budgets without forecasts are wishes. Project your costs 90 days out, minimum, using three scenarios.
Build your base case on current trends and realistic assumptions. Your conservative case models revenue down 20% with costs up 5% – this scenario must be survivable or you're undercapitalized. Your optimistic case projects revenue up 15% with modest cost improvements. If your conservative case shows negative cash flow, you have a fundamental problem requiring immediate attention.
Account for inflation and seasonality. Food costs have increased 35% since pre-pandemic levels, and labor costs are up 35% as well. Build 3-5% annual food inflation and 8-10% labor inflation into projections, especially in markets with minimum wage increases. Don't forget monthly variance – a beach concept in Florida might see 30% swings between January and July.
Track cash flow, not just profit. Profit doesn't pay invoices; cash does. You might show $15,000 paper profit while running out of cash because suppliers demand COD and delivery platforms hold remittance for 48 hours. Map your cash conversion cycle and maintain 3-6 months of operating expenses in reserves. New restaurants rarely hit steady-state revenue immediately – expect month one at 40-50% of target, month two at 60-70%, climbing to full capacity over months 3-6.
Understanding broader restaurant financial management strategies and building comprehensive financial projections helps you anticipate problems before they become crises.
Understanding total cost of ownership for tech and equipment
Restaurant tech decisions often focus on sticker price when they should focus on Total Cost of Ownership over the useful life.
Calculate true equipment costs beyond the purchase price. A $12,000 POS terminal isn't just $12,000. Add installation and setup ($0-$2,000), training (4-16 hours per location at $25-$50/hour), monthly SaaS fees ($50-$249/terminal), payment processing (2.4-3.5% of sales plus $0.15-$0.30 per transaction), annual maintenance (0-25% of hardware value), and PCI compliance programs ($50-$300/month). First-year TCO for a small restaurant typically runs $1,200-$4,500; mid-sized operations hit $3,500-$12,000.
But focus on ROI, not just cost. Modern POS implementation can improve table turnover by 15-20% and reduce wait times by 23%, potentially generating $84,000-$120,000 in additional annual revenue for mid-sized restaurants. POS analytics deliver 3-8% revenue increases and up to 5% food cost reductions, translating to roughly $50,000 in annual savings for restaurants doing $1 million in sales.
Evaluate subscription versus ownership models. Cloud-based systems cost $15-$249/month per terminal but include updates, support, and lower upfront investment. On-premise systems cost $2,000-$15,000 upfront with 15-25% annual maintenance. If cloud costs $150/month ($1,800 annually) and on-premise costs $8,000 upfront plus $1,000 annual maintenance, cloud breaks even around year seven. But if cloud delivers better uptime, faster feature updates, and remote management saving 5 hours monthly at $25/hour, cloud wins in year two. Don't optimize for cheapest – optimize for lowest cost per dollar of revenue generated.
Account for hidden costs of fragmented systems. Every additional system creates integration work, training overhead, and error potential. A manual entry mistake on a delivery order costs you the food, the labor to remake it, and the customer experience. One restaurant reported a 28% reduction in order errors and 9% labor cost decrease within six months after consolidating systems. For a $300,000-revenue location, that 9% labor reduction equals roughly $4,300 monthly in savings. Understanding the ROI of digital tools and conducting cost-benefit analysis of upgrading POS systems prevents costly mistakes.
Practical budgeting discipline and metrics that matter
You don't need fancy software. You need discipline and focus on metrics that drive decisions.
Schedule a weekly 30-minute budget review. Compare sales versus forecast by channel, review top and bottom five menu items by contribution margin, analyze labor hours versus sales by daypart, track waste and comps by category, and set one test or experiment to run next week. This weekly rhythm catches problems before they metastasize into monthly P&L disasters.
Use contribution margin, not just food cost percentage. Food cost percentage tells you what an item costs; contribution margin tells you what it makes. A $14 burger at 30% food cost contributes $9.80. A $22 salmon at 32% food cost contributes $14.96. Sell more salmon. Menu engineering via contribution margin analysis identifies profit-driving dishes and underperformers. Promote your "Stars" (high margin, high popularity), modestly reprice your "Plow horses" (low margin, high popularity), reposition your "Puzzles" (high margin, low popularity), and remove your "Dogs" (low margin, low popularity).
Track five core KPIs weekly: Prime cost percentage (target 55-65%), food cost percentage (investigate variance exceeding 2%), labor cost percentage matched to daypart demand, Revenue per Available Seat Hour (RevPASH, calculated as sales ÷ (seats × hours open)), and average check by daypart to spot trends early. Real-time analytics platforms surface these metrics automatically, eliminating spreadsheet archaeology. Modern systems like Spindl provide dashboards that show your numbers during service when you can still act on them, not days later when the damage is done.
Common budgeting mistakes and how to avoid them
Mistake #1: Setting it and forgetting it. Your budget isn't a yearly exercise – it's weekly discipline. Market conditions shift, suppliers raise prices, and staffing needs change. Review actuals versus budget every week, adjust forecasts monthly, and rebuild projections quarterly.
Mistake #2: Ignoring seasonality and ramp periods. New restaurants don't hit steady-state revenue on day one, and seasonal concepts see 20-30% variance between peak and slow months. Model monthly, not annually. Your bank account doesn't care about yearly averages when February's cash balance hits zero.
Mistake #3: Treating all revenue as equal. Third-party delivery might show strong sales, but after 15-30% commissions, is it profitable? A $35 delivery order yielding $24.50 after commission, with $11.20 food cost and $6.00 labor, leaves $7.30 contribution – decent but not as good as the same order direct. Track profitability by channel and drive customers to your direct channels with incentives that beat third-party economics.
Mistake #4: Penny-wise, pound-foolish tech decisions. Saving $100 monthly on software while losing $1,500 monthly to labor inefficiency is terrible math. Calculate ROI in hours saved or percentage cost reduction. If a tool saves 10+ hours weekly or reduces costs by 2%+, it likely pays for itself. One fast-casual chain achieved 4% lower food costs (~$80,000 annualized) across locations within three months by integrating sales, inventory, and ordering through a unified system.
How integrated platforms impact your bottom line
Fragmented systems create hidden costs: manual re-entry, reconciliation time, missed orders, training overhead, and platform fees stacking up. When your POS talks to your inventory system and auto-deducts ingredients per recipe, you catch waste in real time – not weeks later when the monthly count reveals the damage.
Spindl's all-in-one restaurant management platform consolidates order taking, delivery integration, POS, self-service, loyalty, and analytics into a single device. Operators report fewer errors by eliminating re-keying orders from multiple tablets, lower administrative labor (up to 30% reduction), better insights through real-time dashboards showing COGS, labor, and sales together, and reduced tech costs by replacing 4-8 separate subscriptions with one platform. Explore best practices for using POS analytics and case studies of analytics improving revenues to see how data-driven operators are winning.
For deeper operational context, review restaurant operational efficiency tips and operational efficiency strategies. If your budget is strained by struggles to pay staff or you're wondering why your restaurant isn't profitable despite strong sales, systematic budgeting paired with best digital tools can reveal the leaks draining your profits.
Your 90-day budget implementation plan
Days 1-30: Audit and baseline. Document current revenue by channel and daypart, calculate current prime cost, food cost, and labor cost percentages, map your tech stack and calculate true monthly TCO, and identify your three biggest cost leaks.
Days 31-60: Implement tracking systems. Set up weekly budget review meetings, choose 5-7 core KPIs to track, implement variance tracking for high-cost items like proteins and labor by daypart, and run parallel systems if switching tech to verify accuracy before cutover.
Days 61-90: Optimize and act. Use data to make one menu change (pricing, removal, repositioning), adjust scheduling based on sales-per-labor-hour analysis, negotiate with underperforming vendors or consolidate orders, and measure results against your baseline to inform the next quarter's targets.
Small changes compound. A 2% food cost reduction on $1 million in revenue saves $20,000 annually. Cutting 5 manager hours weekly at $25/hour yields $6,500 in annual savings. Fix three inefficiencies and you've found $30,000+. For inventory-specific improvements, implement inventory management best practices and consider inventory management software that integrates with your POS.
Making budget-informed decisions every day
Every decision impacts your budget – from adding a menu item to hiring a manager to choosing a delivery platform. When evaluating any investment, ask: What's the all-in monthly cost including setup, training, subscriptions, and processing fees? How much time does it save or revenue does it generate? What's the payback period in months? Does it integrate with existing systems or create another silo?
Industry data shows that phased digital transformation can deliver 35% cost reduction and 33% revenue increase – but only when implemented strategically, not as a random collection of shiny apps. Understanding why restaurants lose money and why your restaurant might not be making money despite efforts helps prioritize which budget leaks to fix first.
Stop guessing, start measuring
Restaurant budgeting isn't about restriction – it's about visibility and control. With margins at 3-5% of sales, the difference between thriving and barely surviving comes down to controlling the controllable: food waste, labor efficiency, technology spend, and margin management.
The restaurants winning in 2025 aren't just serving great food. They're leveraging data, consolidating systems, and treating their budget as a competitive advantage. They track weekly, forecast quarterly, and make decisions based on contribution margin rather than gut feel.
Start with a free Spindl demo to see how an integrated platform impacts your cost structure and gives you real-time visibility to make smarter budgeting decisions during service – not days later when it's too late to fix. Your budget and your bottom line will thank you.