Master your restaurant’s cash flow and P&L for better profit

Why does a busy Saturday night sometimes feel like you’re losing money? In an industry where average net profit margins hover around 3–5%, activity doesn't always equal profit. To survive, you must move beyond gut feelings and exert real-time control over your financial data.

The North Star: Mastering prime cost
Your most important financial metric is prime cost, which is the sum of your Cost of Goods Sold (COGS) and total labor costs. In a healthy US restaurant, this should sit between 55% and 65% of total sales. If your prime cost creeps above 65%, you aren't just losing profit; you are flirting with a dangerous restaurant failure mode. Conversely, if it sits below 55%, you may be understaffing or overcharging, which can hurt your brand and guest experience long-term.
Tracking these costs weekly allows you to pivot before the month ends. For most full-service concepts, COGS should target 28–32%, while labor should sit between 25–35%, inclusive of taxes and benefits. Relying on real-time sales data analysis ensures you spot a labor spike on Tuesday and adjust the schedule by Thursday, rather than waiting for a late P&L statement from an accountant.
Cash flow versus profitability
Profit is what exists on paper, but cash flow is the money actually in your bank account to pay vendors. Many restaurants fail because of a cash conversion cycle gap – a scenario where you pay for ingredients on Tuesday but wait days for credit card processors to deposit funds. Managing this requires a daily flash report to keep your finger on the pulse of the business.
Every morning, you should know your net sales broken down by channel, your labor as a percentage of sales, total comps and voids, and your actual cash-on-hand. Using a unified platform like Spindl eliminates the manual "tablet farm" reconciliation that plagues many owners. When your POS and delivery integrations live in one device, your daily flash report is automated rather than a multi-hour spreadsheet chore.
Inventory management and the 5% leak
Food cost variance is the silent profit killer. This is the difference between what you should have used and what you actually used based on sales. A variance above 5% usually signals significant issues with waste and portioning control or even theft. To stop the leak, you must prioritize standardized recipes and yield management.
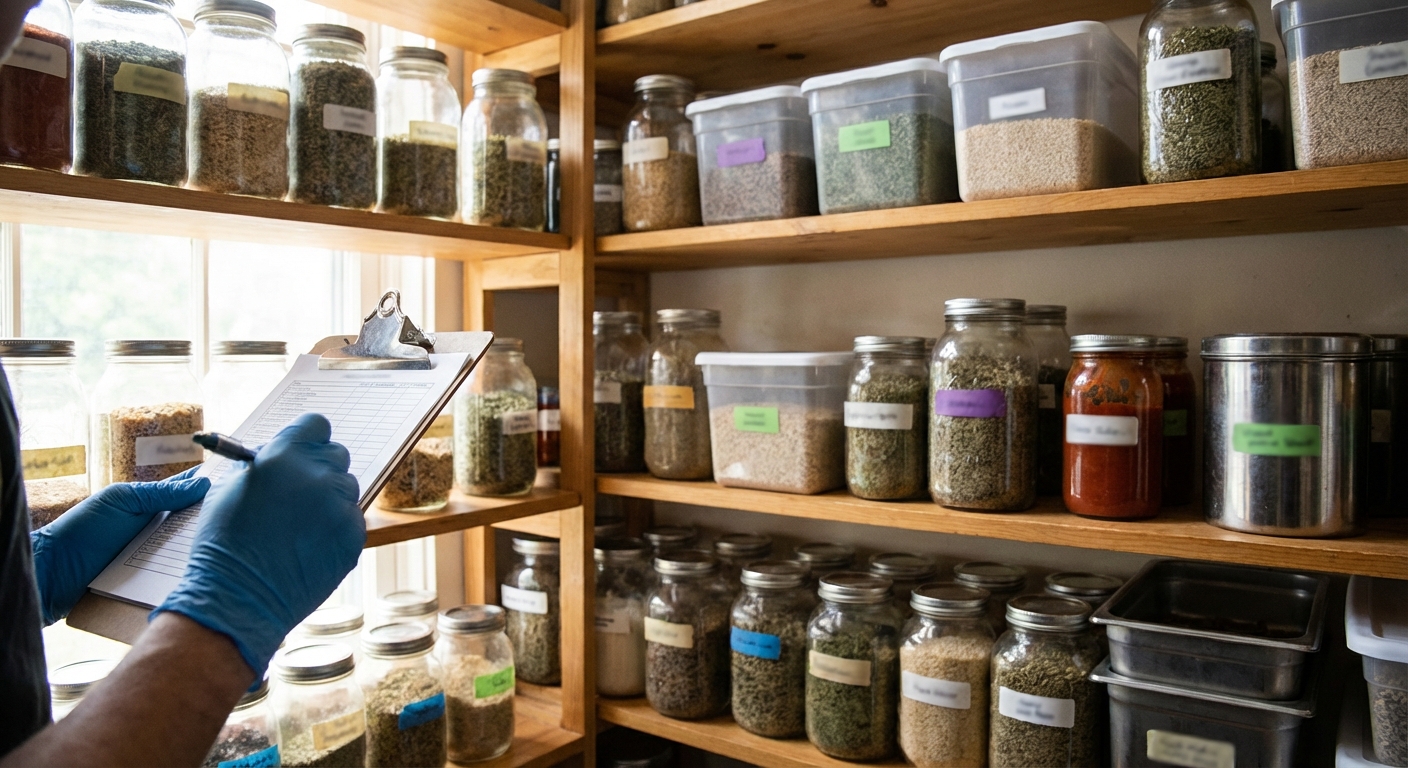
For example, a steakhouse that tightened ribeye portioning saved $850 monthly on a $50,000 spend. You should aim for 4–8 inventory turns per month to prevent capital from rotting on the shelves. Integrating your POS with inventory means every sandwich sold instantly deducts ingredients from your stock, highlighting variances in real-time so you can address problems during the shift.
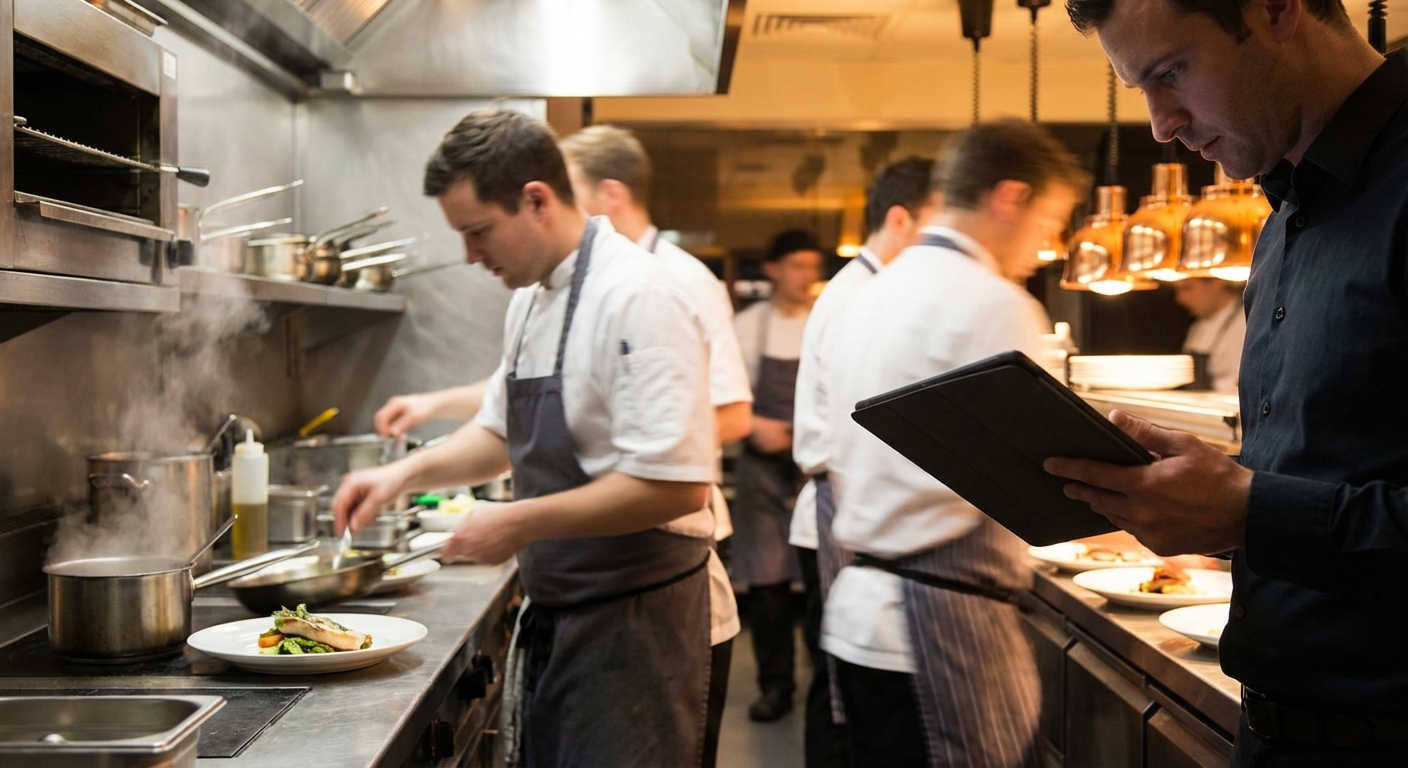
Labor efficiency and scheduling to demand
Labor is your largest controllable expense, yet many managers still schedule based on intuition. The traditional approach of scheduling the same crew every Friday ignores the reality of fluctuating demand. By using POS analytics, you can identify exactly when your 12:30 PM lunch rush drops off, allowing you to cut labor 45 minutes earlier.
A key metric to watch is Sales per Labor Hour (SPLH). You calculate this by dividing total sales for a specific hour by the number of labor hours scheduled. If your target is $150 and you are hitting $80, you are overstaffed. Implementing AI-driven scheduling strategies can reduce labor costs by up to 15% by aligning staff with historical demand.
Managing the delivery margin squeeze
Third-party delivery commissions of 15–30% can turn a profitable dish into a net loss. You must calculate the contribution margin for every sales channel to protect your bottom line. This often requires menu engineering, such as pricing delivery items 10–12% higher than dine-in menus to offset marketplace fees.
To improve margins, consider these strategies:
- Drive customers toward direct online ordering to bypass high marketplace fees.
- Implement self-service kiosks to increase average ticket sizes by 25% while freeing up labor.
- Consolidate all delivery platforms into a single interface to reduce order errors and administrative time.
Spindl acts like an iPhone for your restaurant, while legacy POS systems are the Nokia 3310s. Modernizing your tech stack ensures you aren't paying for five different tablets and redundant software subscriptions.
Your 90-day financial roadmap
The path to profitability requires a structured approach to your data. Your first 30 days should focus on auditing your tech stack to identify where you are losing administrative hours to manual tasks. Between days 31 and 60, build standardized recipes for your top ten sellers and track their variance daily. Finally, by day 90, implement a weekly P&L review and use data-driven decisions to remove underperforming items and optimize your labor spend.
Ready to see your true margins in real-time? Experience the platform and stop losing profit to disconnected data.